Adam Schneider, who is behind the GPS Visualizer web app, has been experimenting with ways of using Google Earth to visualize non-geospatial data. He writes:

I wanted to create a graph of some data that has FOUR dimensions, so I did it in Google Earth.
The data in question is a list — that someone else compiled — of discs used in the sport of disc golf; the four dimensions are:
- “High-Speed Stability” (how much a disc resists turning to the right when thrown with a lot of speed)
- “Low-Speed Stability” (how hard a disc tries to fade left as it slows down)
- “Range” (how far the disc can be thrown)
- “Power Requirement” (how strong of an arm you need to get the disc to do what it’s intended to do)
I used Excel to translate HSS and LSS to latitude and longitude (in the middle of the Pacific Ocean!), used absolute altitude to represent the Power Requirement, and then used GPS Visualizer to colorize the points by Range. Then I created a set of axes in Illustrator and added it as an image overlay.
I suppose if one wanted a FIFTH dimension, you could use time. (If I had translated Power Requirement to time instead of altitude, you could use the timeline to quickly filter out discs on either end of the scale.)
And, it just occurred to me, you could resize the points for a sixth dimension.Now that’s getting to be a bit much. :)
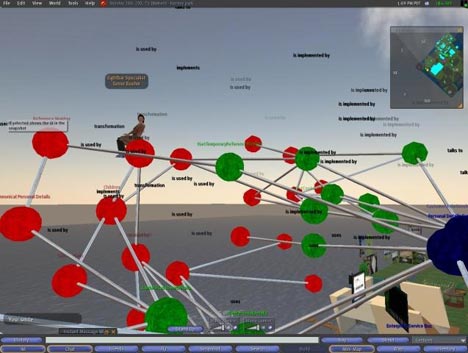
KML’s ability to describe and reference objects in three dimensions clearly lends itself to data visualization experiments of this kind. But so does the Second Life client — IBM has developed some cool examples on its islands, as documented on their Second Life developers’ blog:
So what are the advantages and disadvantages of each? These are the ones I came up with while enjoying free wifi at Budapest airport:
Advantages of Second Life: The client is free to use, even for business. Objects can be scripted, so they can be made to interact with each other, or rearranged according to user inputs. 3D charts can also be viewed and commented on communally inside the application — and you can also point out interesting elements by physically going to the datapoint in questions and flagging it; others will see you do it.
Advantages for Google Earth: You can publish your chart as KML for free — in Second Life, you need to buy or rent property before you get the ability to build on it, and even then the rules may be restrictive. (You can practice in a “sand box” in Second Life, but nothing there is permanent, so you can’t direct people to it via a permalink.) A KML/KMZ 3D chart object is also easily portable, in that it is a file which you can email. In Second Life, by contrast, objects exist in-world only, on Linden Lab’s servers, so you have to direct people there via a URL (“slurl”).
When it comes to static data objects,, you currently have to build these manually in Second Life — whereas it is relatively straightforward to convert a spreadsheet of data into KML via XSLT, as EditGrid does, because you’re mainly doing text manipulation. Nothing equivalent exists for Second Life at the moment.
When it comes to dynamic data updates, both applications lets you use information on the web to update chart objects: In Google Earth, it’s doable via a network link, though then the conversion to KML has to be done server-side, while in Second Life, URLs can be called from within the scripting language and then massaged accordingly. In both cases, you need to write the data manipulation code beforehand and serve it from your own server (in Google Earth) or via objects on your own property (in Second Life).
Both applications will continue to improve, and may start adopting some of each other’s features, but there are also other applications being developed that may be aimed more specifically at 3D visualizations for business, such as Ogoglio. So this is a very interesting space to watch.
(Interestingly, Second Life has also seen a weather visualization experiment — taking advantage of SL’s scripting abilities to convert coordinate data into SL’s Cartesian coordinate system.)
In my copious free time I’m building a 100M2 walkable map of Iraq in an Ogoglio space. I whipped up a simple mesh and sat layer (noted here), but I still need to write the server side script to pull in a GeoRSS or KML feed for events in the area.
While this is an interesting use of the applications, don’t overlook the power of Acrobat 3D for distributing 3D models.