One feature request people have had in the year since the introduction of Google Earth is the ability to visualize vertical data. With the introduction of textures in Google Earth a few weeks ago, I suspected that this would now be possible, but it took a weekend morning away from the distractions of internet connectivity to finally find out.
A few weeks before the launch of Google Earth 4 beta, CloudSat was successfully activated. This satellite takes vertical cross-section images of clouds, and the raw data is published on the internet, annotated with coordinates. This would make its dataset an excellent candidate for this kind of visualization, I thought.
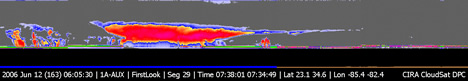
Alberto, June 12, 2006. Click to enlarge.
Of the images available, I chose the snapshot of hurricane Alberto over the Gulf of Mexico, taken on June 12. I converted the image to PNG format, with the gray made transparent. In SketchUp, I then created a vertical surface, imported the image as a texture, and hid the boundaries.
I knew the coordinates of the image’s ends, so I tried to use the integration feature between Google Earth and SketchUp. Unfortunately for this project, the scale is far too large — the applications only work together at neighborghood-level scales, for reasons that soon became apparent.
Instead, I exported manually from SketchUp. I opened up the KMZ file (on the Mac, change the “.kmz” to “.zip”, then double-click) and altered the doc.kml file for scale and location.
While this let me set the starting coordinates and scale properly, it turns out that objects imported into Google Earth from SketchUp don’t use the polar coordinate system, but true 3D, as the imported object looked like this:
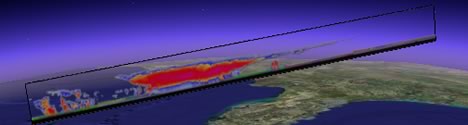
This presented a challenge that I might have been able to try to solve in a number of ways: Using an image manipulation tool to manually curve in the image and then orienting the resulting structure so that slices into the Earth slightly; figure out a way of converting the 3D to polar coordinates; or cutting the image into smaller segments, and importing each individually, so that the lack of curvature in the image is less apparent.
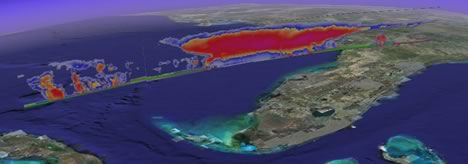
As I was on an internetless island (I thought), I did not have access to the tools for pursuing the first two solutions, so I cut the image into fours component parts and imported them separately, with some overlap. Here is the resulting KMZ file. It looks like this:
In sum, it works, though there is plenty of opportunity for automating this proof of concept, so that manual tweaks become part of the production pipeline. Ideally, too, we’d get to choose which coordinate system to import objects to — that would make the process a whole lot smoother.
Also, it’s pretty clear that CloudSat’s data has a vertical exaggeration, but I left it as is as I don’t know what the accurate scale is. Finally, This data is painted onto straight planes, when in fact the satellite’s path curves slighly over the surface of the Earth, so the coordinates I used are not exact. These are all solvable issues, however. It would be quite a coup should CloudSat’s scientists ever end up publishing such vertical data live as a network link in Google Earth.
[Posted as a result of the island I’m on playing host to the Gotland Runt classic sailing race this weekend, with as consequence that the entire main village has been thoroughly wimaxed. (Live tracking of yachts, though not with Google Earth, inexplicably.) It’s getting harder and harder to get away from technology these days.]
Just so folks know – the KMZ file provided is for GE 4 only…
Hey Stefan, Good work! I was just thinking about usuing GE to illustrate some Geology things and a geological cross section could be useful. It reminds me of the book cover to Tuftes book on graphical illustration, that was about 3D clouds.
Rich
Great feature, and cool illustration. Wake up U.S. http://anthonylemons.blogspot.com